Software Design Document#
The Software Design Document (SDD) provides a comprehensive overview of the design and architecture of Anomalib. It is intended for developers, architects, and anyone interested in the technical underpinnings of the software.
1. Introduction#
Purpose#
The purpose of this document is to give a detailed overview of the architecture, components, and design decisions of Anomalib. It serves as a guide for new developers and a reference for all stakeholders involved in development.
Scope#
This section outlines the scope of the software, including its intended functionality, user base, and integration with other systems or technologies.
2. Overall Description#
Product Perspective#
Anomalib is a deep learning library that aims to collect state-of-the-art anomaly detection algorithms for benchmarking on both public and private datasets. Anomalib provides several ready-to-use implementations of anomaly detection algorithms described in the recent literature, as well as a set of tools that facilitate the development and implementation of custom models. The library has a strong focus on visual anomaly detection, where the goal of the algorithm is to detect and/or localize anomalies within images or videos in a dataset.
Product Features#
Modular Design
Offers a plug-and-play architecture that allows users to easily modify the existing anomaly detection algorithms or add new ones based on their specific requirements.
Wide Algorithm Support
Includes implementations of the state-of-the-art (sota) anomaly detection algorithms, covering a variety of techniques such as autoencoders, GANs, flow-based models, and more.
Real-time Detection
With a support of multiple inferencers such as Torch, Lightning, ONNX, OpenVINO and Gradio, Anomalib is capable of performing real-time anomaly detection on streaming data.
Visualization Tools
Comes with a suite of visualization tools for analyzing anomalies, understanding model decisions, and interpreting results.
Customization and Extensibility
Provides APIs for customization and extension, enabling researchers and practitioners to experiment with sota algorithms and techniques.
Comprehensive Documentation and Community Support
Features detailed documentation and a supportive community forum to assist users in implementation and troubleshooting.
User Classes and Characteristics#
Research Scientists
Academics and researchers conducting studies in anomaly detection, requiring a flexible toolset for experimenting with different models and techniques.
Data Scientists and Analysts
Professionals looking to incorporate anomaly detection into their data analysis workflows without diving deeper into algorithmic complexities.
Machine Learning Engineers
Individuals focused on developing and deploying anomaly detection models, seeking a library that offers sota algorithms.
Industry Practitioners
Specialists in sectors like manufacturing, healthcare and security, who need to detect and respond to anomalies as part of risk management and quality control processes.
Operating Environment#
Anomalib is designed to be environment-agnostic, capable of running on a variety of platforms including standalone desktop environments, on-premises servers, and cloud-based infrastructures. The library supports both CPU and GPU-based processing, with the latter providing significant performance improvements for large-scale anomaly detection tasks. The library also supports edge devices for real-time anomaly detection in IoT and embedded systems.
Assumptions and Dependencies#
Anomalib’s effectiveness and performance are dependent on the quality and granularity of the input data, as well as the appropriateness of the chosen anomaly detection algorithms for the specific use case. It assumes that users have a basic understanding of anomaly detection principles and are familiar with Python programming for custom implementations.
3. System Architecture#
Architectural Overview#
Anomalib is designed with a focus on modular, scalable, and flexible architecture to meet the diverse needs of anomaly detection across various domains.
High-Level Workflow#

As shown in Figure 1, Anomalib’s high-level workflow consists of the following components:
Training [Optional]: Involves training the anomaly detection model to learn patterns and characteristics of normal behavior. This step is optional for unsupervised algorithms. For zero-shot learning, the model is not trained on any specific dataset.
Validation/Test: Validates the model by finding the threshold for anomaly detection and testing the model’s performance on a validation or test dataset.
Optimization [Optional]: Involves optimizing the model by converting it to a more efficient form, such as a compressed or quantized model. This step utilizes tools such as ONNX, OpenVINO for optimization.
Deployment: Deploys the model to a production environment for real-time or batch anomaly detection. This step uses multiple tools such as Torch, Lightning, ONNX, OpenVINO and Gradio for deployment.
High-Level Architecture#
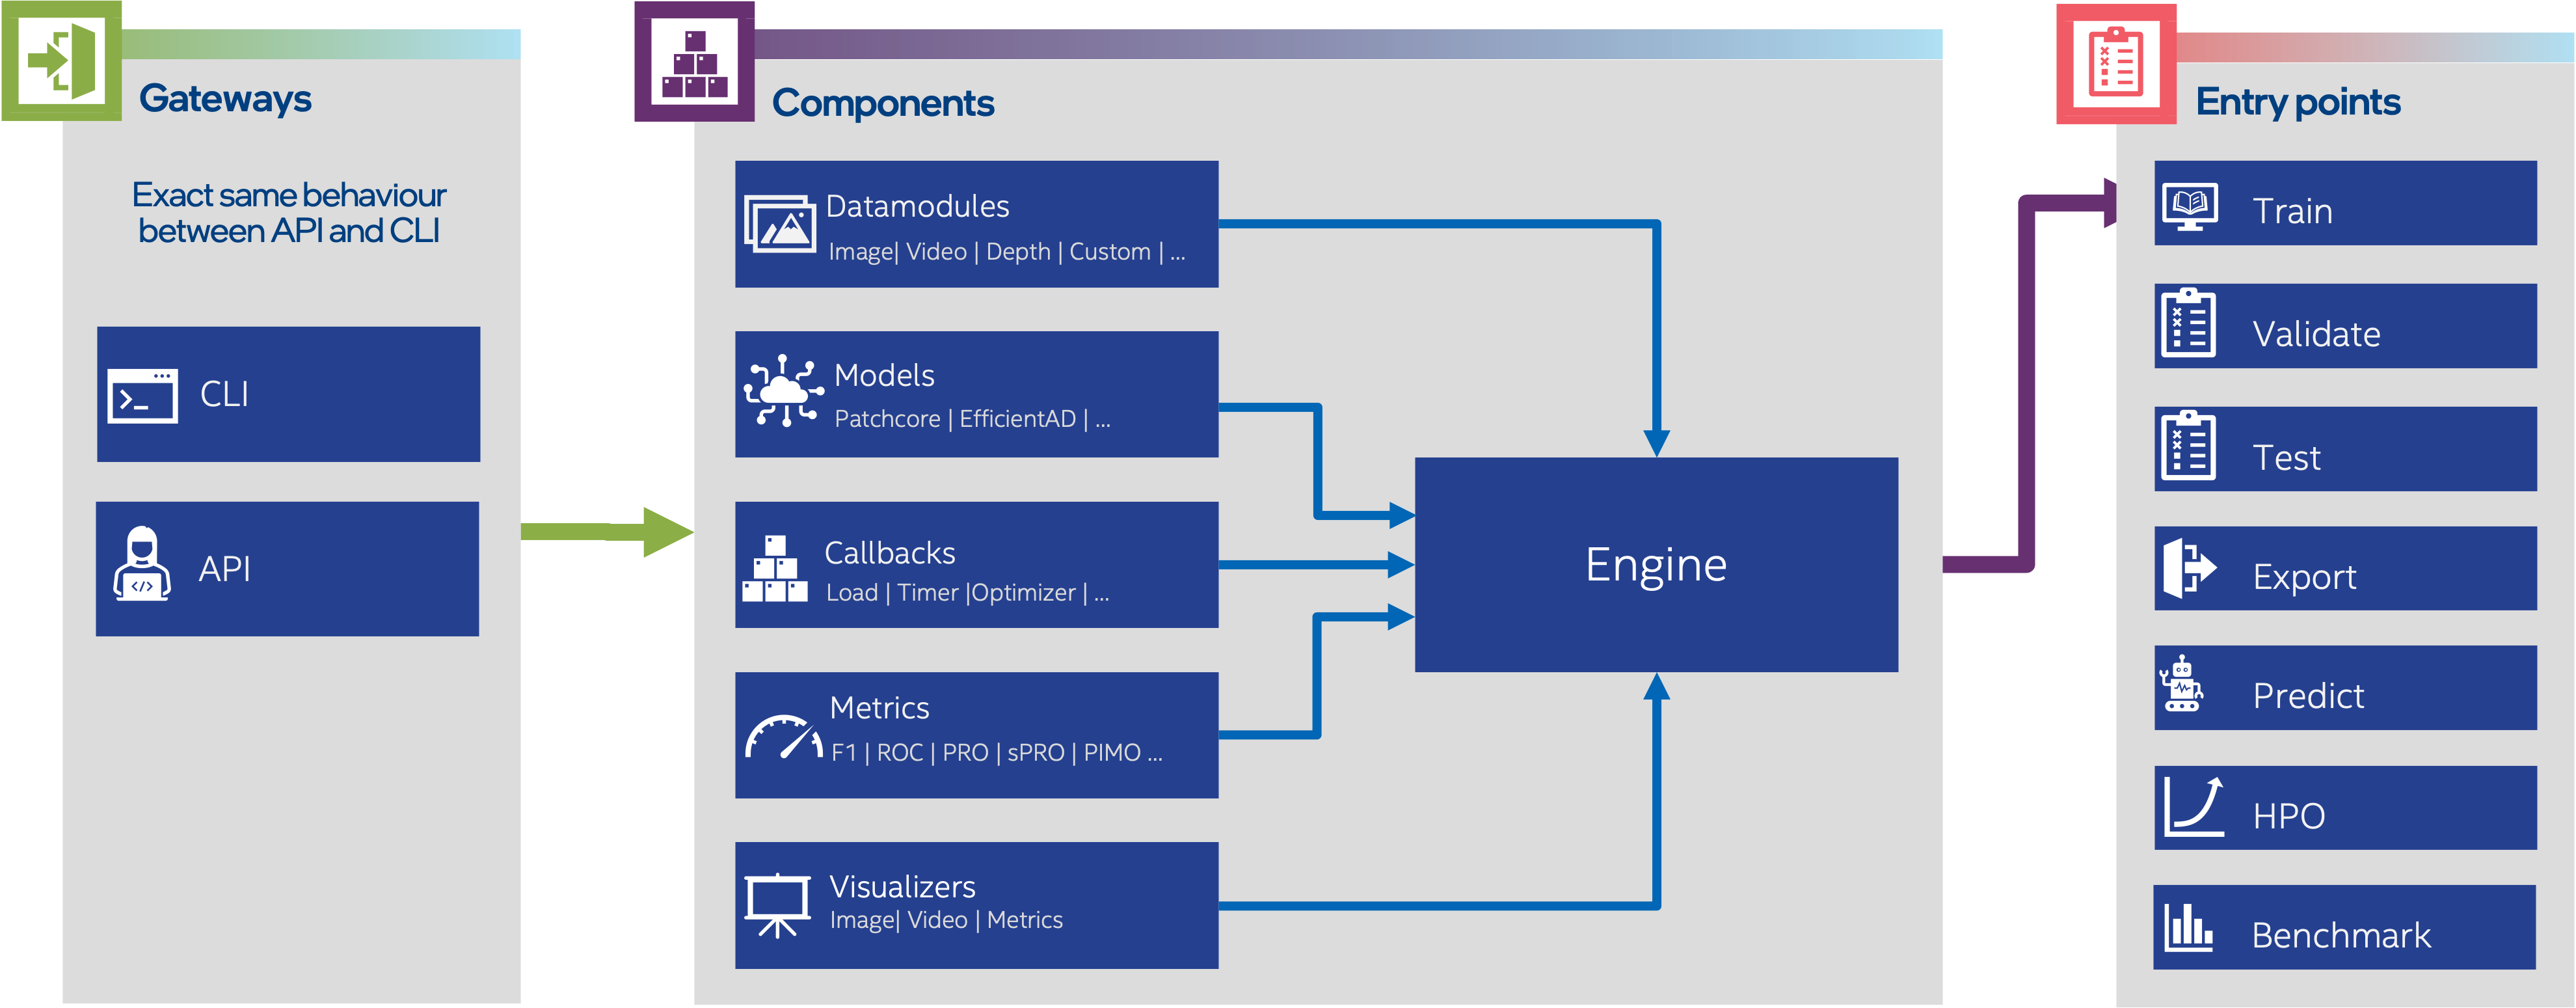
As shown in Figure 2, Anomalib’s high-level architecture consists of the following components: API/CLI, Components and Entry Points.
API/CLI: Provides an interface for users to interact with the library, including APIs for data ingestion, configuration, and result export, as well as a command-line interface for running anomaly detection tasks. Both API and CLI provides the same functionality.
Components: Consists of the core components of Anomalib, including, Datamodules, Models, Callbacks, Metrics, Visualizers and Engine.
Entry Points: Includes the main entry points for running anomaly detection tasks, such as
train,validate,test,export, andpredict.
4. Detailed System Design#
Here we will provide a detailed overview of the design and architecture of Anomalib, including the CLI, core components and entyrpoints.
CLI#

As shown in Figure 3, Anomalib’s command-line interface (CLI) provides a user-friendly way to interact with the library, allowing users to run anomaly detection tasks, configure algorithms, and visualize results. The CLI is implemented using LightningCLI, a command-line interface framework for PyTorch Lightning that uses jsonargparse for argument parsing. This allows users to sync their CLI arguments with their Python code, making it easier to maintain and update.
Datamodules#
Datamodules in anomalib are responsible for preparing the data for training,
validation, and testing. They are implemented using PyTorch Lightning’s
LightningDataModule class, which provides a set of APIs for loading,
preprocessing, and splitting the data. The datamodules are designed to be
modular and extensible, allowing users to easily modify the data loading and
preprocessing steps based on their specific requirements. Anomalib has a base
datamodule, which is sub-classes by image, video and depth datamodules to
provide the necessary functionality for loading and preprocessing image, video
and depth data.

Models#
Anomalib provides a collection of anomaly models within the image and video
domains. The models are implemented sub-classing PyTorch Lightning’s
LightningModule class, which is called AnomalibModule, which provides a set
of APIs for defining the model architecture, loss function, and optimization
algorithm. The models are designed to be modular and extensible, allowing users
to easily modify the model architecture and training workflow based on their
specific requirements. Anomalib has a base model, which is sub-classes by
algorithm implementations such as autoencoders, GANs, flow-based models, and
more. The figure below demonstrates the high-level overview of model
architecture, and the implementation of Patchcore model.

Callbacks#
We use LightningCallbacks to add functionality to the training loop, such as
logging, early stopping, and model checkpointing. For more details, refer to the
Lightning Callbacks documentation.
In addition to the built-in callbacks, we have implemented custom callbacks for
anomaly detection tasks, which could be accessed through the callbacks module.
Metrics#
Similar to callbacks, we make use of Lightning Torchmetrics package, which
provides a collection of metrics for evaluating model performance. For more
details, refer to the Torchmetrics documentation.
We have also implemented custom metrics such as PRO, sPRO and PIMO for anomaly
detection tasks, which could be accessed through the metrics module.
Visualizers#
Anomalib provides a suite of visualization tools for analyzing anomalies,
understanding model decisions, and interpreting results. Currently we have
implemented visualizers for image and metrics, which could be accessed through
ImageVisualizer and MetricsVisualizer classes, respectively. The figure
below demonstrates the high-level overview of visualizers.

Engine#
The figure below demonstrates the high-level architecture of the engine, which is responsible for orchestrating the anomaly detection workflow, including data preparation, model training, validation, testing, export and predict.
Under the hood, Engine uses Lightning’s Trainer to manage the training
workflow. One of the main distinguishing features of the Engine is its ability
of caching arguments to create the Trainer class after the datamodule and model
are created or modified. This allows the user to modify the datamodule and model
without having to re-create the Trainer class.
Another important feature of the Engine is its ability to export the trained
model to OpenVINO format for deployment on edge devices. This is achieved by
using the openvino module, which provides a set of tools for converting
PyTorch models to OpenVINO format.

Overall, Anomalib is designed with a focus on modular, scalable, and flexible architecture to meet the diverse needs of anomaly detection across various domains. The library provides a comprehensive set of tools for data preparation, model training, validation, testing, export, and predict, as well as a suite of visualization tools for analyzing anomalies, understanding model decisions, and interpreting results.